GeoTUI::Results - Study 2
 |
06 March 2007 Experiments at the IFP (Prototype version 3) |
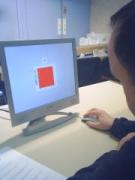
GUI / Mouse
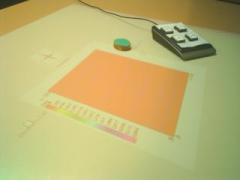
TUI / 1-puck prop
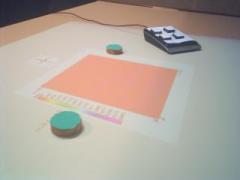
TUI / 2-puck prop
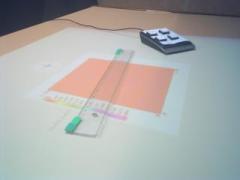
TUI / ruler prop
GeoTUI::Results - Study 2
|
|||||
GUI / Mouse |
TUI / 1-puck prop |
TUI / 2-puck prop |
TUI / ruler prop |
||
| Cutting planes performed | ||
|
[GUI / Mouse] [TUI / 1-puck prop] [TUI / 2-puck prop] [TUI / Ruler prop] |
Scoring of cutting planes performed: [ 1 2 3 4 ]
|
Caption :
|
| Number of cutting lines performed | |
 Exercises 1 and 2 Averages numbers of cutting planes performed for each exercise, using different interactions. |
Results of significance: |
| Calculation of significance |
|
* One-way analysis of variance were performed using the Analysis Tools of MS Excel. * Paired t tests and Wilcoxon Signed Rank tests were performed using the following web calculators: t-Value and p-Value: http://faculty.vassar.edu/lowry/t_corr_stats.html z-Value and p-Value: http://faculty.vassar.edu/lowry/wilcoxon.html * Paired t tests were also performed using the following formula in a spreadsheet to calculate the t-Value: (Extracted from: http://mathworld.wolfram.com/Pairedt-Test.html)
Given two paired sets
 and and  of of  measured values. measured values. and and  are the average of and , respectively. are the average of and , respectively.Let    and    Define  by by This statistic has  degrees of freedom. degrees of freedom.and then the associated p-Value was obtained using the following web calculator: http://www.danielsoper.com/statcalc/calc08.aspx |
|
 |